


DEMetropolis 和 DEMetropolis(Z) 算法比较#
import time

import arviz as az
import matplotlib.pyplot as plt
import numpy as np
import pandas as pd
import pymc as pm
import scipy.stats as st

print(f"Running on PyMC v{pm.__version__}")
WARNING (pytensor.tensor.blas): Using NumPy C-API based implementation for BLAS functions.
Running on PyMC v0+untagged.9358.g8ea092d
az.style.use("arviz-darkgrid")
rng = np.random.default_rng(1234)
背景#
对于连续变量,默认的 PyMC 采样器 (NUTS) 需要计算梯度,PyMC 通过自动微分实现这一点。然而,在某些情况下,PyMC 模型可能未提供梯度(例如,通过在 PyMC 外部评估数值模型),因此需要替代采样器。差分进化 (DE) Metropolis 采样器是无梯度推断的有效选择。本笔记本比较了 PyMC 中的 DEMetropolis 和 DEMetropolisZ 采样器,以帮助确定哪个是给定问题的更佳选择。
这些采样器基于 和 ter Braak 和 Vrugt [2008],并在笔记本 DEMetropolis(Z) 采样器调优 中进行了描述。差分进化的思想是使用从其他链(DEMetropolis)或当前链的过去抽取(DEMetropolis(Z))中随机选择的抽取来进行更明智的提议,从而提高标准 Metropolis 实现的采样效率。请注意,PyMC 中 DEMetropolisZ 的实现与 ter Braak 和 Vrugt [2008] 中的略有不同,即每个 DEMetropolisZ 链仅查看其自身的历史记录,而 ter Braak 和 Vrugt [2008] 算法在链之间进行了一些混合。
在本笔记本中,将使用 DEMetropolis 和 DEMetropolisZ 采样器对 10 维和 50 维多元正态目标密度进行采样。采样器将根据有效样本量、采样时间和 MCMC 链相关性 \((\hat{R})\) 进行评估。还将与 NUTS 进行比较以进行基准测试。最后,将 MCMC 轨迹与解析计算的目标概率密度进行比较,以评估高维度中的潜在偏差。
主要结论(TL;DR)#
根据本笔记本中的结果,对于较低维度的问题 (\(\approx10D\)),请使用 DEMetropolisZ,对于较高维度的问题 (\(\approx50D\)),请使用 DEMetropolis。
DEMetropolisZ采样器比DEMetropolis更有效率(每秒采样的 ESS)。DEMetropolisZ采样器比DEMetropolis具有更好的链收敛性 \((\hat{R})\)。偏差在 50 维度的
DEMetropolisZ采样器中很明显,导致与目标分布相比方差减小。DEMetropolis更准确地采样了高维目标分布,使用了 \(2D\) 链(模型参数数量的两倍)。正如预期的那样,
NUTS比任何基于 Metropolis 的算法都更有效率和准确。
辅助函数#
本节定义了将在整个笔记本中使用的辅助函数。
D 维 MvNormal 目标分布和 PyMC 模型#
gen_mvnormal_params 生成目标分布的参数,这是一个多元正态分布,在前五个维度中 \(\sigma^2\) = [1, 2, 3, 4, 5],并加入了一些相关性。
显示代码单元格源
def gen_mvnormal_params(D):
    # means=zero
    mu = np.zeros(D)
    # sigma**2 = 1 to start
    cov = np.eye(D)
    # manually adjust the first 5 dimensions
    # sigma**2 in the first 5 dimensions = 1, 2, 3, 4, 5
    # with a little covariance added
    cov[:5, :5] = np.array(
        [
            [1, 0.5, 0, 0, 0],
            [0.5, 2, 2, 0, 0],
            [0, 2, 3, 0, 0],
            [0, 0, 0, 4, 4],
            [0, 0, 0, 4, 5],
        ]
    )
    return mu, cov
make_model 接受多元正态参数 mu 和 cov,并输出 PyMC 模型。
显示代码单元格源
def make_model(mu, cov):
    with pm.Model() as model:
        x = pm.MvNormal("x", mu=mu, cov=cov, shape=(len(mu),))
    return model
采样#
sample_model 执行 MCMC,返回轨迹和采样持续时间。
显示代码单元格源
def sample_model(
    model, D, run=0, step_class=pm.DEMetropolis, cores=1, chains=1, step_kwargs={}, sample_kwargs={}
):
    # sampler name
    sampler = step_class.name
    # sample model

    # if nuts then do not provide step method
    if sampler == "nuts":
        with model:
            step = step_class(**step_kwargs)
            t_start = time.time()
            idata = pm.sample(
                # step=step,
                chains=chains,
                cores=cores,
                initvals={"x": [0] * D},
                discard_tuned_samples=False,
                progressbar=False,
                random_seed=2020 + run,
                **sample_kwargs
            )
            t = time.time() - t_start

    # signature for DEMetropolis samplers
    else:
        with model:
            step = step_class(**step_kwargs)
            t_start = time.time()
            idata = pm.sample(
                step=step,
                chains=chains,
                cores=cores,
                initvals={"x": [0] * D},
                discard_tuned_samples=False,
                progressbar=False,
                random_seed=2020 + run,
                **sample_kwargs
            )
            t = time.time() - t_start

    return idata, t
calc_mean_ess 计算分布维度的平均 ess。
显示代码单元格源
def calc_mean_ess(idata):
    return az.ess(idata).x.values.mean()
calc_mean_rhat 计算分布维度的平均 \(\hat{R}\)。
显示代码单元格源
def calc_mean_rhat(idata):
    return az.rhat(idata).x.values.mean()
sample_model_calc_metrics 包装了先前定义的函数:对模型进行采样,计算指标并将结果打包到 Pandas DataFrame 中
显示代码单元格源
def sample_model_calc_metrics(
    sampler,
    D,
    tune,
    draws,
    cores=1,
    chains=1,
    run=0,
    step_kwargs=dict(proposal_dist=pm.NormalProposal, tune="scaling"),
    sample_kwargs={},
):
    mu, cov = gen_mvnormal_params(D)
    model = make_model(mu, cov)
    idata, t = sample_model(
        model,
        D,
        step_class=sampler,
        cores=cores,
        chains=chains,
        run=run,
        step_kwargs=step_kwargs,
        sample_kwargs=dict(sample_kwargs, **dict(tune=tune, draws=draws)),
    )
    ess = calc_mean_ess(idata)
    rhat = calc_mean_rhat(idata)
    results = dict(
        Sampler=sampler.__name__,
        D=D,
        Chains=chains,
        Cores=cores,
        tune=tune,
        draws=draws,
        ESS=ess,
        Time_sec=t,
        ESSperSec=ess / t,
        rhat=rhat,
        Trace=[idata],
    )
    return pd.DataFrame(results)
concat_results 连接结果并进行一些数据整理和计算。
显示代码单元格源
def concat_results(results):
    results_df = pd.concat(results)

    results_df["Run"] = results_df.Sampler + "\nChains=" + results_df.Chains.astype(str)

    results_df["ESS_pct"] = results_df.ESS * 100 / (results_df.Chains * results_df.draws)
    return results_df
绘图#
plot_comparison_bars 绘制 ESS 和 \(\hat{R}\) 结果以进行比较。
显示代码单元格源
def plot_comparison_bars(results_df):
    fig, axes = plt.subplots(1, 3, figsize=(10, 5))
    ax = axes[0]
    results_df.plot.bar(y="ESSperSec", x="Run", ax=ax, legend=False)
    ax.set_title("ESS per Second")
    ax.set_xlabel("")
    labels = ax.get_xticklabels()

    ax = axes[1]
    results_df.plot.bar(y="ESS_pct", x="Run", ax=ax, legend=False)
    ax.set_title("ESS Percentage")
    ax.set_xlabel("")
    labels = ax.get_xticklabels()

    ax = axes[2]
    results_df.plot.bar(y="rhat", x="Run", ax=ax, legend=False)
    ax.set_title(r"$\hat{R}$")
    ax.set_xlabel("")
    ax.set_ylim(1)
    labels = ax.get_xticklabels()

    plt.suptitle(f"Comparison of Runs for {D} Dimensional Target Distribution", fontsize=16)
    plt.tight_layout()
plot_forest_compare_analytical 绘制前 5 个维度的 MCMC 结果,并与解析计算的概率密度进行比较。
显示代码单元格源
def plot_forest_compare_analytical(results_df):
    # extract the first 5 dimensions
    summaries = []
    truncated_traces = []
    dimensions = 5
    for row in results_df.index:
        truncated_trace = results_df.Trace.loc[row].posterior.x[:, :, :dimensions]
        truncated_traces.append(truncated_trace)
        summary = az.summary(truncated_trace)
        summary["Run"] = results_df.at[row, "Run"]
        summaries.append(summary)
    summaries = pd.concat(summaries)

    # plot forest
    axes = az.plot_forest(
        truncated_traces, combined=True, figsize=(8, 3), model_names=results_df.Run
    )
    ax = axes[0]

    # plot analytical solution
    yticklabels = ax.get_yticklabels()
    yticklocs = [tick.__dict__["_y"] for tick in yticklabels]
    min, max = axes[0].get_ylim()
    width = (max - min) / 6
    mins = [ytickloc - (width / 2) for ytickloc in yticklocs]
    maxes = [ytickloc + (width / 2) for ytickloc in yticklocs]
    sigmas = [np.sqrt(sigma2) for sigma2 in range(1, 6)]
    for i, (sigma, min, max) in enumerate(zip(sigmas, mins[::-1], maxes[::-1])):
        # scipy.stats.norm to calculate analytical marginal distribution
        dist = st.norm(0, sigma)
        ax.vlines(dist.ppf(0.03), min, max, color="black", linestyle=":")
        ax.vlines(dist.ppf(0.97), min, max, color="black", linestyle=":")
        ax.vlines(dist.ppf(0.25), min, max, color="black", linestyle=":")
        ax.vlines(dist.ppf(0.75), min, max, color="black", linestyle=":")
        if i == 0:
            ax.text(dist.ppf(0.97) + 0.2, min, "Analytical Solutions\n(Dotted)", fontsize=8)

    # legend
    labels = ax.get_legend().__dict__["texts"]
    labels = [label.__dict__["_text"] for label in labels]
    handles = ax.get_legend().__dict__["legendHandles"]
    ax.legend(
        handles[::-1],
        labels[::-1],
        loc="center left",
        bbox_to_anchor=(1, 0.5),
        fontsize="medium",
        fancybox=True,
        title="94% and 50% HDI",
    )
    ax.set_title(
        f"Comparison of MCMC Samples and Analytical Solutions\nFirst 5 Dimensions of {D} Dimensional Target Distribution"
    )
plot_forest_compare_analytical_dim5 绘制第五个 5 维度的 MCMC 结果,并与解析计算的概率密度进行比较,以进行重复运行以进行偏差检查。
显示代码单元格源
def plot_forest_compare_analytical_dim5(results_df):
    # extract the 5th dimension
    summaries = []
    truncated_traces = []
    dimension_idx = 4
    for row in results_df.index:
        truncated_trace = results_df.Trace.loc[row].posterior.x[:, :, dimension_idx]
        truncated_traces.append(truncated_trace)
        summary = az.summary(truncated_trace)
        summary["Sampler"] = results_df.at[row, "Sampler"]
        summaries.append(summary)
    summaries = pd.concat(summaries)
    cols = ["Sampler", "mean", "sd", "hdi_3%", "hdi_97%", "ess_bulk", "ess_tail", "r_hat"]
    summary_means = summaries[cols].groupby("Sampler").mean()

    # scipy.stats.norm to calculate analytical marginal distribution
    dist = st.norm(0, np.sqrt(5))
    summary_means.at["Analytical", "mean"] = 0
    summary_means.at["Analytical", "sd"] = np.sqrt(5)
    summary_means.at["Analytical", "hdi_3%"] = dist.ppf(0.03)
    summary_means.at["Analytical", "hdi_97%"] = dist.ppf(0.97)

    # plot forest
    colors = plt.rcParams["axes.prop_cycle"].by_key()["color"]
    axes = az.plot_forest(
        truncated_traces,
        combined=True,
        figsize=(8, 3),
        colors=[colors[0]] * reps + [colors[1]] * reps + [colors[2]] * reps,
        model_names=results_df.Sampler,
    )
    ax = axes[0]

    # legend
    labels = ax.get_legend().__dict__["texts"]
    labels = [label.__dict__["_text"] for label in labels]
    handles = ax.get_legend().__dict__["legendHandles"]
    labels = [labels[reps - 1]] + [labels[reps * 2 - 1]] + [labels[reps * 3 - 1]]
    handles = [handles[reps - 1]] + [handles[reps * 2 - 1]] + [handles[reps * 3 - 1]]
    ax.legend(
        handles[::-1],
        labels[::-1],
        loc="center left",
        bbox_to_anchor=(1, 0.5),
        fontsize="medium",
        fancybox=True,
        title="94% and 50% HDI",
    )
    ax.set_title(
        f"Comparison of MCMC Samples and Analytical Solutions\n5th Dimension of {D} Dimensional Target Distribution"
    )

    # plot analytical solution as vlines
    ax.axvline(dist.ppf(0.03), color="black", linestyle=":")
    ax.axvline(dist.ppf(0.97), color="black", linestyle=":")
    ax.text(dist.ppf(0.97) + 0.1, 0, "Analytical Solution\n(Dotted)", fontsize=8)
    return summaries, summary_means
实验 #1. 10 维目标分布#
所有轨迹均使用 cores=1 进行采样。令人惊讶的是,对于相同总样本数,使用单核采样比使用多核采样对于两种采样器都更慢。
DEMetropolisZ 和 NUTS 使用四个链进行采样,而 DEMetropolis 则根据 ter Braak 和 Vrugt [2008] 使用更多链进行采样。DEMetropolis 要求,至少,\(N\) 链大于 \(D\) 维度。然而,{cite:t}terBraak2008differential 建议对于 \(D<50\),\(2D<N<3D\),对于更高维度的问题或复杂的后验,\(10D<N<20D\)。
以下代码列出了此实验的运行。
# dimensions
D = 10
# total samples are constant for Metropolis algorithms
total_samples = 200000
samplers = [pm.DEMetropolisZ] + [pm.DEMetropolis] * 3 + [pm.NUTS]
coreses = [1] * 5
chainses = [4, 1 * D, 2 * D, 3 * D, 4]
# calculate the number of tunes and draws for each run
tunes = drawses = [int(total_samples / chains) for chains in chainses]
# manually adjust NUTs, which needs fewer samples
tunes[-1] = drawses[-1] = 2000
# put it in a dataframe for display and QA/QC
pd.DataFrame(
    dict(
        sampler=[s.name for s in samplers],
        tune=tunes,
        draws=drawses,
        chains=chainses,
        cores=coreses,
    )
).style.set_caption("MCMC Runs for 10-Dimensional Experiment")
| 采样器 | 调优 | 抽取 | 链 | 核 | |
|---|---|---|---|---|---|
| 0 | DEMetropolisZ | 50000 | 50000 | 4 | 1 |
| 1 | DEMetropolis | 20000 | 20000 | 10 | 1 |
| 2 | DEMetropolis | 10000 | 10000 | 20 | 1 |
| 3 | DEMetropolis | 6666 | 6666 | 30 | 1 |
| 4 | nuts | 2000 | 2000 | 4 | 1 |
results = []
run = 0
for sampler, tune, draws, cores, chains in zip(samplers, tunes, drawses, coreses, chainses):
    if sampler.name == "nuts":
        results.append(
            sample_model_calc_metrics(
                sampler, D, tune, draws, cores=cores, chains=chains, run=run, step_kwargs={}
            )
        )
    else:
        results.append(
            sample_model_calc_metrics(sampler, D, tune, draws, cores=cores, chains=chains, run=run)
        )
    run += 1
显示代码单元格输出
Sequential sampling (4 chains in 1 job)
DEMetropolisZ: [x]
Sampling 4 chains for 50_000 tune and 50_000 draw iterations (200_000 + 200_000 draws total) took 123 seconds.
Population sampling (10 chains)
DEMetropolis: [x]
C:\Users\greg\Documents\CodingProjects_ongoing\pymc\pymc\pymc\sampling\population.py:84: UserWarning: DEMetropolis should be used with more chains than dimensions! (The model has 10 dimensions.)
  warn_population_size(
Chains are not parallelized. You can enable this by passing `pm.sample(cores=n)`, where n > 1.
Sampling 10 chains for 20_000 tune and 20_000 draw iterations (200_000 + 200_000 draws total) took 142 seconds.
The rhat statistic is larger than 1.01 for some parameters. This indicates problems during sampling. See https://arxiv.org/abs/1903.08008 for details
The effective sample size per chain is smaller than 100 for some parameters.  A higher number is needed for reliable rhat and ess computation. See https://arxiv.org/abs/1903.08008 for details
Population sampling (20 chains)
DEMetropolis: [x]
Chains are not parallelized. You can enable this by passing `pm.sample(cores=n)`, where n > 1.
Sampling 20 chains for 10_000 tune and 10_000 draw iterations (200_000 + 200_000 draws total) took 147 seconds.
Population sampling (30 chains)
DEMetropolis: [x]
Chains are not parallelized. You can enable this by passing `pm.sample(cores=n)`, where n > 1.
Sampling 30 chains for 6_666 tune and 6_666 draw iterations (199_980 + 199_980 draws total) took 153 seconds.
Auto-assigning NUTS sampler...
Initializing NUTS using jitter+adapt_diag...
Sequential sampling (4 chains in 1 job)
NUTS: [x]
Sampling 4 chains for 2_000 tune and 2_000 draw iterations (8_000 + 8_000 draws total) took 59 seconds.
Chain <xarray.DataArray 'chain' ()>
array(0)
Coordinates:
    chain    int32 0 reached the maximum tree depth. Increase `max_treedepth`, increase `target_accept` or reparameterize.
Chain <xarray.DataArray 'chain' ()>
array(1)
Coordinates:
    chain    int32 1 reached the maximum tree depth. Increase `max_treedepth`, increase `target_accept` or reparameterize.
Chain <xarray.DataArray 'chain' ()>
array(2)
Coordinates:
    chain    int32 2 reached the maximum tree depth. Increase `max_treedepth`, increase `target_accept` or reparameterize.
Chain <xarray.DataArray 'chain' ()>
array(3)
Coordinates:
    chain    int32 3 reached the maximum tree depth. Increase `max_treedepth`, increase `target_accept` or reparameterize.
results_df = concat_results(results)
results_df = results_df.reset_index(drop=True)
cols = results_df.columns
results_df[cols[~cols.isin(["Trace", "Run"])]].round(2).style.set_caption(
    "Results of MCMC Sampling of 10-Dimensional Target Distribution"
)
| 采样器 | D | 链 | 核 | 调优 | 抽取 | ESS | 时间_秒 | 每秒 ESS | rhat | ESS_pct | |
|---|---|---|---|---|---|---|---|---|---|---|---|
| 0 | DEMetropolisZ | 10 | 4 | 1 | 50000 | 50000 | 6296.480000 | 127.650000 | 49.330000 | 1.000000 | 3.150000 |
| 1 | DEMetropolis | 10 | 10 | 1 | 20000 | 20000 | 3492.280000 | 147.460000 | 23.680000 | 1.000000 | 1.750000 |
| 2 | DEMetropolis | 10 | 20 | 1 | 10000 | 10000 | 5537.930000 | 156.310000 | 35.430000 | 1.000000 | 2.770000 |
| 3 | DEMetropolis | 10 | 30 | 1 | 6666 | 6666 | 5657.900000 | 166.250000 | 34.030000 | 1.010000 | 2.830000 |
| 4 | NUTS | 10 | 4 | 1 | 2000 | 2000 | 7731.260000 | 72.360000 | 106.850000 | 1.000000 | 96.640000 |
plot_comparison_bars(results_df)
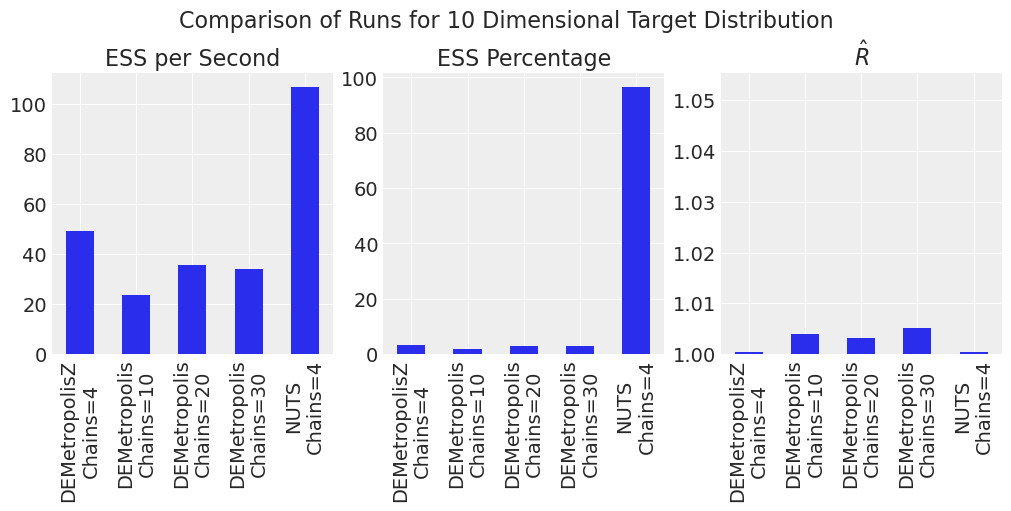
NUTs 是最有效率的。DEMetropolisZ 比 DEMetropolis 更有效率,并且具有更低的 \(\hat{R}\)。
plot_forest_compare_analytical(results_df)
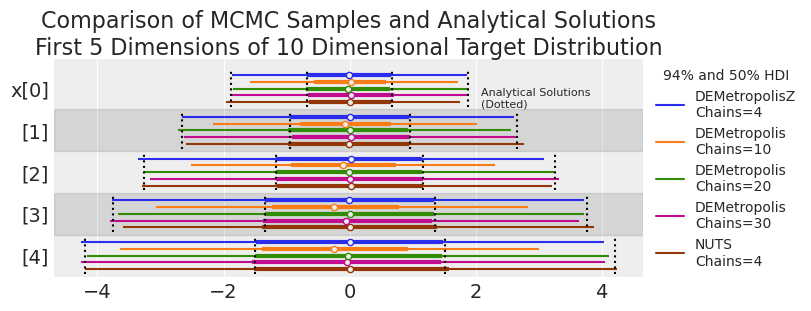
基于目视检查,轨迹已合理收敛到目标分布,除了 10 个链的 DEMetropolis 外,这支持了对于 10 维问题,链的数量应至少为维度数量的 2 倍的建议。
实验 #2. 50 维目标分布#
让我们在 50 维度中重复,但为 DEMetropolis 算法使用更多链。
# dimensions
D = 50
# total samples are constant for Metropolis algorithms
total_samples = 200000
samplers = [pm.DEMetropolisZ] + [pm.DEMetropolis] * 3 + [pm.NUTS]
coreses = [1] * 5
chainses = [4, 2 * D, 10 * D, 20 * D, 4]
# calculate the number of tunes and draws for each run
tunes = drawses = [int(total_samples / chains) for chains in chainses]
# manually adjust NUTs, which needs fewer samples
tunes[-1] = drawses[-1] = 2000
# put it in a dataframe for display and QA/QC
pd.DataFrame(
    dict(
        sampler=[s.name for s in samplers],
        tune=tunes,
        draws=drawses,
        chains=chainses,
        cores=coreses,
    )
).style.set_caption("MCMC Runs for 50-Dimensional Experiment")
| 采样器 | 调优 | 抽取 | 链 | 核 | |
|---|---|---|---|---|---|
| 0 | DEMetropolisZ | 50000 | 50000 | 4 | 1 |
| 1 | DEMetropolis | 2000 | 2000 | 100 | 1 |
| 2 | DEMetropolis | 400 | 400 | 500 | 1 |
| 3 | DEMetropolis | 200 | 200 | 1000 | 1 |
| 4 | nuts | 2000 | 2000 | 4 | 1 |
results = []
run = 0
for sampler, tune, draws, cores, chains in zip(samplers, tunes, drawses, coreses, chainses):
    if sampler.name == "nuts":
        results.append(
            sample_model_calc_metrics(
                sampler,
                D,
                tune,
                draws,
                cores=cores,
                chains=chains,
                run=run,
                step_kwargs={},
                sample_kwargs=dict(nuts=dict(target_accept=0.95)),
            )
        )
    else:
        results.append(
            sample_model_calc_metrics(sampler, D, tune, draws, cores=cores, chains=chains, run=run)
        )
    run += 1
显示代码单元格输出
Sequential sampling (4 chains in 1 job)
DEMetropolisZ: [x]
Sampling 4 chains for 50_000 tune and 50_000 draw iterations (200_000 + 200_000 draws total) took 148 seconds.
The rhat statistic is larger than 1.01 for some parameters. This indicates problems during sampling. See https://arxiv.org/abs/1903.08008 for details
Population sampling (100 chains)
DEMetropolis: [x]
Chains are not parallelized. You can enable this by passing `pm.sample(cores=n)`, where n > 1.
Sampling 100 chains for 2_000 tune and 2_000 draw iterations (200_000 + 200_000 draws total) took 185 seconds.
The rhat statistic is larger than 1.01 for some parameters. This indicates problems during sampling. See https://arxiv.org/abs/1903.08008 for details
The effective sample size per chain is smaller than 100 for some parameters.  A higher number is needed for reliable rhat and ess computation. See https://arxiv.org/abs/1903.08008 for details
Only 400 samples in chain.
Population sampling (500 chains)
DEMetropolis: [x]
Chains are not parallelized. You can enable this by passing `pm.sample(cores=n)`, where n > 1.
Sampling 500 chains for 400 tune and 400 draw iterations (200_000 + 200_000 draws total) took 214 seconds.
c:\Users\greg\.conda\envs\pymc-dev\Lib\site-packages\arviz\data\base.py:221: UserWarning: More chains (500) than draws (400). Passed array should have shape (chains, draws, *shape)
  warnings.warn(
The rhat statistic is larger than 1.01 for some parameters. This indicates problems during sampling. See https://arxiv.org/abs/1903.08008 for details
The effective sample size per chain is smaller than 100 for some parameters.  A higher number is needed for reliable rhat and ess computation. See https://arxiv.org/abs/1903.08008 for details
Only 200 samples in chain.
Population sampling (1000 chains)
DEMetropolis: [x]
Chains are not parallelized. You can enable this by passing `pm.sample(cores=n)`, where n > 1.
Sampling 1000 chains for 200 tune and 200 draw iterations (200_000 + 200_000 draws total) took 245 seconds.
c:\Users\greg\.conda\envs\pymc-dev\Lib\site-packages\arviz\data\base.py:221: UserWarning: More chains (1000) than draws (200). Passed array should have shape (chains, draws, *shape)
  warnings.warn(
The rhat statistic is larger than 1.01 for some parameters. This indicates problems during sampling. See https://arxiv.org/abs/1903.08008 for details
The effective sample size per chain is smaller than 100 for some parameters.  A higher number is needed for reliable rhat and ess computation. See https://arxiv.org/abs/1903.08008 for details
Auto-assigning NUTS sampler...
Initializing NUTS using jitter+adapt_diag...
Sequential sampling (4 chains in 1 job)
NUTS: [x]
Sampling 4 chains for 2_000 tune and 2_000 draw iterations (8_000 + 8_000 draws total) took 94 seconds.
Chain <xarray.DataArray 'chain' ()>
array(0)
Coordinates:
    chain    int32 0 reached the maximum tree depth. Increase `max_treedepth`, increase `target_accept` or reparameterize.
Chain <xarray.DataArray 'chain' ()>
array(1)
Coordinates:
    chain    int32 1 reached the maximum tree depth. Increase `max_treedepth`, increase `target_accept` or reparameterize.
Chain <xarray.DataArray 'chain' ()>
array(2)
Coordinates:
    chain    int32 2 reached the maximum tree depth. Increase `max_treedepth`, increase `target_accept` or reparameterize.
Chain <xarray.DataArray 'chain' ()>
array(3)
Coordinates:
    chain    int32 3 reached the maximum tree depth. Increase `max_treedepth`, increase `target_accept` or reparameterize.
results_df = concat_results(results)
results_df = results_df.reset_index(drop=True)
cols = results_df.columns
results_df[cols[~cols.isin(["Trace", "Run"])]].round(2).style.set_caption(
    "Results of MCMC Sampling of 50-Dimensional Target Distribution"
)
| 采样器 | D | 链 | 核 | 调优 | 抽取 | ESS | 时间_秒 | 每秒 ESS | rhat | ESS_pct | |
|---|---|---|---|---|---|---|---|---|---|---|---|
| 0 | DEMetropolisZ | 50 | 4 | 1 | 50000 | 50000 | 1309.830000 | 163.870000 | 7.990000 | 1.000000 | 0.650000 |
| 1 | DEMetropolis | 50 | 100 | 1 | 2000 | 2000 | 792.730000 | 236.830000 | 3.350000 | 1.090000 | 0.400000 |
| 2 | DEMetropolis | 50 | 500 | 1 | 400 | 400 | 1083.880000 | 415.260000 | 2.610000 | 1.410000 | 0.540000 |
| 3 | DEMetropolis | 50 | 1000 | 1 | 200 | 200 | 1616.890000 | 633.760000 | 2.550000 | 1.710000 | 0.810000 |
| 4 | NUTS | 50 | 4 | 1 | 2000 | 2000 | 10570.020000 | 105.300000 | 100.380000 | 1.000000 | 132.130000 |
plot_comparison_bars(results_df)
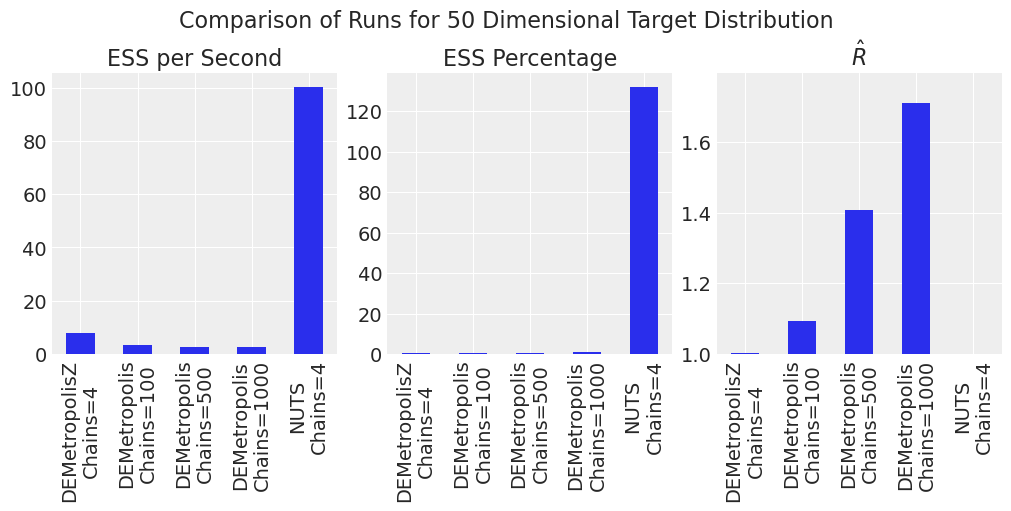
对于更高维度,NUTS 相对于 DEMetropolisZ 相对于 DEMetropolis 的效率优势更加明显。对于此样本大小和链数,DEMetropolis 的 \(\hat{R}\) 也很大。对于 DEMetropolis,较少数量的链 (\(2N\)) 和更多数量的样本比更多链和更少样本表现更好。与直觉相反,NUTS 采样器产生的 \(ESS\) 值大于样本数,这可能会发生,如 此处 所述。
plot_forest_compare_analytical(results_df)
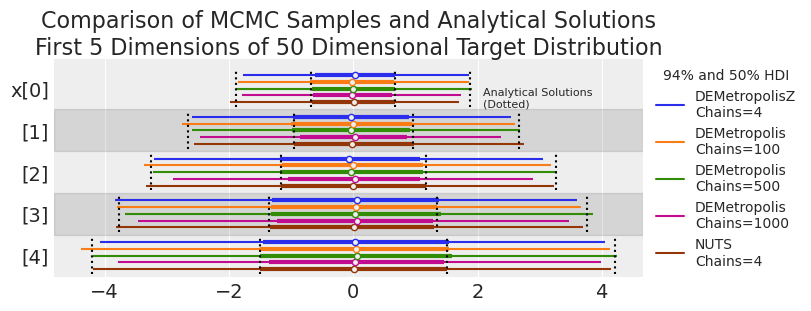
我们可能在某些 DEMetropolis 运行的尾部看到低覆盖率(即,MCMC HDI 始终小于解析解)。让我们在下一个实验中更系统地探索这一点。
实验 #3. 准确性和偏差#
我们想确保 DEMetropolis 采样器为高维问题提供覆盖率(即,尾部被适当地采样)。我们将通过多次运行算法并与 NUTS 和解析计算的概率密度进行比较来测试偏差。我们将在许多维度中执行 MCMC,但为了简单起见,我们将分析方差最大的维度(维度 5)的结果。
10 维度#
首先检查 10 维度。我们将为每次运行执行 10 次重复。DEMetropolis 将在 \(2D\) 链上运行。调整和抽取的数量经过定制,以获得大于 2000 的有效采样器大小。
D = 10
reps = 10
samplers = [pm.DEMetropolis] * reps + [pm.DEMetropolisZ] * reps + [pm.NUTS] * reps
coreses = [1] * reps * 3
chainses = [2 * D] * reps + [4] * reps * 2
tunes = drawses = [5000] * reps + [25000] * reps + [1000] * reps

results = []
run = 0
for sampler, tune, draws, cores, chains in zip(samplers, tunes, drawses, coreses, chainses):
    if sampler.name == "nuts":
        results.append(
            sample_model_calc_metrics(
                sampler,
                D,
                tune,
                draws,
                cores=cores,
                chains=chains,
                run=run,
                step_kwargs={},
                sample_kwargs=dict(target_accept=0.95),
            )
        )
    else:
        results.append(
            sample_model_calc_metrics(sampler, D, tune, draws, cores=cores, chains=chains, run=run)
        )
    run += 1
显示代码单元格输出
Population sampling (20 chains)
DEMetropolis: [x]
Chains are not parallelized. You can enable this by passing `pm.sample(cores=n)`, where n > 1.
Sampling 20 chains for 5_000 tune and 5_000 draw iterations (100_000 + 100_000 draws total) took 92 seconds.
Population sampling (20 chains)
DEMetropolis: [x]
Chains are not parallelized. You can enable this by passing `pm.sample(cores=n)`, where n > 1.
Sampling 20 chains for 5_000 tune and 5_000 draw iterations (100_000 + 100_000 draws total) took 81 seconds.
Population sampling (20 chains)
DEMetropolis: [x]
Chains are not parallelized. You can enable this by passing `pm.sample(cores=n)`, where n > 1.
Sampling 20 chains for 5_000 tune and 5_000 draw iterations (100_000 + 100_000 draws total) took 81 seconds.
The rhat statistic is larger than 1.01 for some parameters. This indicates problems during sampling. See https://arxiv.org/abs/1903.08008 for details
Population sampling (20 chains)
DEMetropolis: [x]
Chains are not parallelized. You can enable this by passing `pm.sample(cores=n)`, where n > 1.
Sampling 20 chains for 5_000 tune and 5_000 draw iterations (100_000 + 100_000 draws total) took 82 seconds.
The rhat statistic is larger than 1.01 for some parameters. This indicates problems during sampling. See https://arxiv.org/abs/1903.08008 for details
Population sampling (20 chains)
DEMetropolis: [x]
Chains are not parallelized. You can enable this by passing `pm.sample(cores=n)`, where n > 1.
Sampling 20 chains for 5_000 tune and 5_000 draw iterations (100_000 + 100_000 draws total) took 81 seconds.
Population sampling (20 chains)
DEMetropolis: [x]
Chains are not parallelized. You can enable this by passing `pm.sample(cores=n)`, where n > 1.
Sampling 20 chains for 5_000 tune and 5_000 draw iterations (100_000 + 100_000 draws total) took 86 seconds.
The rhat statistic is larger than 1.01 for some parameters. This indicates problems during sampling. See https://arxiv.org/abs/1903.08008 for details
Population sampling (20 chains)
DEMetropolis: [x]
Chains are not parallelized. You can enable this by passing `pm.sample(cores=n)`, where n > 1.
Sampling 20 chains for 5_000 tune and 5_000 draw iterations (100_000 + 100_000 draws total) took 81 seconds.
Population sampling (20 chains)
DEMetropolis: [x]
Chains are not parallelized. You can enable this by passing `pm.sample(cores=n)`, where n > 1.
Sampling 20 chains for 5_000 tune and 5_000 draw iterations (100_000 + 100_000 draws total) took 85 seconds.
The rhat statistic is larger than 1.01 for some parameters. This indicates problems during sampling. See https://arxiv.org/abs/1903.08008 for details
Population sampling (20 chains)
DEMetropolis: [x]
Chains are not parallelized. You can enable this by passing `pm.sample(cores=n)`, where n > 1.
Sampling 20 chains for 5_000 tune and 5_000 draw iterations (100_000 + 100_000 draws total) took 96 seconds.
The rhat statistic is larger than 1.01 for some parameters. This indicates problems during sampling. See https://arxiv.org/abs/1903.08008 for details
Population sampling (20 chains)
DEMetropolis: [x]
Chains are not parallelized. You can enable this by passing `pm.sample(cores=n)`, where n > 1.
Sampling 20 chains for 5_000 tune and 5_000 draw iterations (100_000 + 100_000 draws total) took 86 seconds.
The rhat statistic is larger than 1.01 for some parameters. This indicates problems during sampling. See https://arxiv.org/abs/1903.08008 for details
Sequential sampling (4 chains in 1 job)
DEMetropolisZ: [x]
Sampling 4 chains for 25_000 tune and 25_000 draw iterations (100_000 + 100_000 draws total) took 70 seconds.
Sequential sampling (4 chains in 1 job)
DEMetropolisZ: [x]
Sampling 4 chains for 25_000 tune and 25_000 draw iterations (100_000 + 100_000 draws total) took 77 seconds.
Sequential sampling (4 chains in 1 job)
DEMetropolisZ: [x]
Sampling 4 chains for 25_000 tune and 25_000 draw iterations (100_000 + 100_000 draws total) took 76 seconds.
Sequential sampling (4 chains in 1 job)
DEMetropolisZ: [x]
Sampling 4 chains for 25_000 tune and 25_000 draw iterations (100_000 + 100_000 draws total) took 76 seconds.
Sequential sampling (4 chains in 1 job)
DEMetropolisZ: [x]
Sampling 4 chains for 25_000 tune and 25_000 draw iterations (100_000 + 100_000 draws total) took 79 seconds.
Sequential sampling (4 chains in 1 job)
DEMetropolisZ: [x]
Sampling 4 chains for 25_000 tune and 25_000 draw iterations (100_000 + 100_000 draws total) took 72 seconds.
Sequential sampling (4 chains in 1 job)
DEMetropolisZ: [x]
Sampling 4 chains for 25_000 tune and 25_000 draw iterations (100_000 + 100_000 draws total) took 69 seconds.
Sequential sampling (4 chains in 1 job)
DEMetropolisZ: [x]
Sampling 4 chains for 25_000 tune and 25_000 draw iterations (100_000 + 100_000 draws total) took 77 seconds.
Sequential sampling (4 chains in 1 job)
DEMetropolisZ: [x]
Sampling 4 chains for 25_000 tune and 25_000 draw iterations (100_000 + 100_000 draws total) took 72 seconds.
Sequential sampling (4 chains in 1 job)
DEMetropolisZ: [x]
Sampling 4 chains for 25_000 tune and 25_000 draw iterations (100_000 + 100_000 draws total) took 78 seconds.
Auto-assigning NUTS sampler...
Initializing NUTS using jitter+adapt_diag...
Sequential sampling (4 chains in 1 job)
NUTS: [x]
Sampling 4 chains for 1_000 tune and 1_000 draw iterations (4_000 + 4_000 draws total) took 42 seconds.
Chain <xarray.DataArray 'chain' ()>
array(0)
Coordinates:
    chain    int32 0 reached the maximum tree depth. Increase `max_treedepth`, increase `target_accept` or reparameterize.
Chain <xarray.DataArray 'chain' ()>
array(1)
Coordinates:
    chain    int32 1 reached the maximum tree depth. Increase `max_treedepth`, increase `target_accept` or reparameterize.
Chain <xarray.DataArray 'chain' ()>
array(2)
Coordinates:
    chain    int32 2 reached the maximum tree depth. Increase `max_treedepth`, increase `target_accept` or reparameterize.
Chain <xarray.DataArray 'chain' ()>
array(3)
Coordinates:
    chain    int32 3 reached the maximum tree depth. Increase `max_treedepth`, increase `target_accept` or reparameterize.
Auto-assigning NUTS sampler...
Initializing NUTS using jitter+adapt_diag...
Sequential sampling (4 chains in 1 job)
NUTS: [x]
Sampling 4 chains for 1_000 tune and 1_000 draw iterations (4_000 + 4_000 draws total) took 43 seconds.
Chain <xarray.DataArray 'chain' ()>
array(0)
Coordinates:
    chain    int32 0 reached the maximum tree depth. Increase `max_treedepth`, increase `target_accept` or reparameterize.
Chain <xarray.DataArray 'chain' ()>
array(1)
Coordinates:
    chain    int32 1 reached the maximum tree depth. Increase `max_treedepth`, increase `target_accept` or reparameterize.
Chain <xarray.DataArray 'chain' ()>
array(2)
Coordinates:
    chain    int32 2 reached the maximum tree depth. Increase `max_treedepth`, increase `target_accept` or reparameterize.
Chain <xarray.DataArray 'chain' ()>
array(3)
Coordinates:
    chain    int32 3 reached the maximum tree depth. Increase `max_treedepth`, increase `target_accept` or reparameterize.
Auto-assigning NUTS sampler...
Initializing NUTS using jitter+adapt_diag...
Sequential sampling (4 chains in 1 job)
NUTS: [x]
Sampling 4 chains for 1_000 tune and 1_000 draw iterations (4_000 + 4_000 draws total) took 40 seconds.
Chain <xarray.DataArray 'chain' ()>
array(0)
Coordinates:
    chain    int32 0 reached the maximum tree depth. Increase `max_treedepth`, increase `target_accept` or reparameterize.
Chain <xarray.DataArray 'chain' ()>
array(1)
Coordinates:
    chain    int32 1 reached the maximum tree depth. Increase `max_treedepth`, increase `target_accept` or reparameterize.
Chain <xarray.DataArray 'chain' ()>
array(2)
Coordinates:
    chain    int32 2 reached the maximum tree depth. Increase `max_treedepth`, increase `target_accept` or reparameterize.
Chain <xarray.DataArray 'chain' ()>
array(3)
Coordinates:
    chain    int32 3 reached the maximum tree depth. Increase `max_treedepth`, increase `target_accept` or reparameterize.
Auto-assigning NUTS sampler...
Initializing NUTS using jitter+adapt_diag...
Sequential sampling (4 chains in 1 job)
NUTS: [x]
Sampling 4 chains for 1_000 tune and 1_000 draw iterations (4_000 + 4_000 draws total) took 43 seconds.
Chain <xarray.DataArray 'chain' ()>
array(0)
Coordinates:
    chain    int32 0 reached the maximum tree depth. Increase `max_treedepth`, increase `target_accept` or reparameterize.
Chain <xarray.DataArray 'chain' ()>
array(1)
Coordinates:
    chain    int32 1 reached the maximum tree depth. Increase `max_treedepth`, increase `target_accept` or reparameterize.
Chain <xarray.DataArray 'chain' ()>
array(2)
Coordinates:
    chain    int32 2 reached the maximum tree depth. Increase `max_treedepth`, increase `target_accept` or reparameterize.
Chain <xarray.DataArray 'chain' ()>
array(3)
Coordinates:
    chain    int32 3 reached the maximum tree depth. Increase `max_treedepth`, increase `target_accept` or reparameterize.
Auto-assigning NUTS sampler...
Initializing NUTS using jitter+adapt_diag...
Sequential sampling (4 chains in 1 job)
NUTS: [x]
Sampling 4 chains for 1_000 tune and 1_000 draw iterations (4_000 + 4_000 draws total) took 47 seconds.
Chain <xarray.DataArray 'chain' ()>
array(0)
Coordinates:
    chain    int32 0 reached the maximum tree depth. Increase `max_treedepth`, increase `target_accept` or reparameterize.
Chain <xarray.DataArray 'chain' ()>
array(1)
Coordinates:
    chain    int32 1 reached the maximum tree depth. Increase `max_treedepth`, increase `target_accept` or reparameterize.
Chain <xarray.DataArray 'chain' ()>
array(2)
Coordinates:
    chain    int32 2 reached the maximum tree depth. Increase `max_treedepth`, increase `target_accept` or reparameterize.
Chain <xarray.DataArray 'chain' ()>
array(3)
Coordinates:
    chain    int32 3 reached the maximum tree depth. Increase `max_treedepth`, increase `target_accept` or reparameterize.
Auto-assigning NUTS sampler...
Initializing NUTS using jitter+adapt_diag...
Sequential sampling (4 chains in 1 job)
NUTS: [x]
Sampling 4 chains for 1_000 tune and 1_000 draw iterations (4_000 + 4_000 draws total) took 37 seconds.
Chain <xarray.DataArray 'chain' ()>
array(0)
Coordinates:
    chain    int32 0 reached the maximum tree depth. Increase `max_treedepth`, increase `target_accept` or reparameterize.
Chain <xarray.DataArray 'chain' ()>
array(1)
Coordinates:
    chain    int32 1 reached the maximum tree depth. Increase `max_treedepth`, increase `target_accept` or reparameterize.
Chain <xarray.DataArray 'chain' ()>
array(2)
Coordinates:
    chain    int32 2 reached the maximum tree depth. Increase `max_treedepth`, increase `target_accept` or reparameterize.
Chain <xarray.DataArray 'chain' ()>
array(3)
Coordinates:
    chain    int32 3 reached the maximum tree depth. Increase `max_treedepth`, increase `target_accept` or reparameterize.
Auto-assigning NUTS sampler...
Initializing NUTS using jitter+adapt_diag...
Sequential sampling (4 chains in 1 job)
NUTS: [x]
Sampling 4 chains for 1_000 tune and 1_000 draw iterations (4_000 + 4_000 draws total) took 44 seconds.
Chain <xarray.DataArray 'chain' ()>
array(0)
Coordinates:
    chain    int32 0 reached the maximum tree depth. Increase `max_treedepth`, increase `target_accept` or reparameterize.
Chain <xarray.DataArray 'chain' ()>
array(1)
Coordinates:
    chain    int32 1 reached the maximum tree depth. Increase `max_treedepth`, increase `target_accept` or reparameterize.
Chain <xarray.DataArray 'chain' ()>
array(2)
Coordinates:
    chain    int32 2 reached the maximum tree depth. Increase `max_treedepth`, increase `target_accept` or reparameterize.
Chain <xarray.DataArray 'chain' ()>
array(3)
Coordinates:
    chain    int32 3 reached the maximum tree depth. Increase `max_treedepth`, increase `target_accept` or reparameterize.
Auto-assigning NUTS sampler...
Initializing NUTS using jitter+adapt_diag...
Sequential sampling (4 chains in 1 job)
NUTS: [x]
Sampling 4 chains for 1_000 tune and 1_000 draw iterations (4_000 + 4_000 draws total) took 42 seconds.
Chain <xarray.DataArray 'chain' ()>
array(0)
Coordinates:
    chain    int32 0 reached the maximum tree depth. Increase `max_treedepth`, increase `target_accept` or reparameterize.
Chain <xarray.DataArray 'chain' ()>
array(1)
Coordinates:
    chain    int32 1 reached the maximum tree depth. Increase `max_treedepth`, increase `target_accept` or reparameterize.
Chain <xarray.DataArray 'chain' ()>
array(2)
Coordinates:
    chain    int32 2 reached the maximum tree depth. Increase `max_treedepth`, increase `target_accept` or reparameterize.
Chain <xarray.DataArray 'chain' ()>
array(3)
Coordinates:
    chain    int32 3 reached the maximum tree depth. Increase `max_treedepth`, increase `target_accept` or reparameterize.
Auto-assigning NUTS sampler...
Initializing NUTS using jitter+adapt_diag...
Sequential sampling (4 chains in 1 job)
NUTS: [x]
Sampling 4 chains for 1_000 tune and 1_000 draw iterations (4_000 + 4_000 draws total) took 43 seconds.
Chain <xarray.DataArray 'chain' ()>
array(0)
Coordinates:
    chain    int32 0 reached the maximum tree depth. Increase `max_treedepth`, increase `target_accept` or reparameterize.
Chain <xarray.DataArray 'chain' ()>
array(1)
Coordinates:
    chain    int32 1 reached the maximum tree depth. Increase `max_treedepth`, increase `target_accept` or reparameterize.
Chain <xarray.DataArray 'chain' ()>
array(2)
Coordinates:
    chain    int32 2 reached the maximum tree depth. Increase `max_treedepth`, increase `target_accept` or reparameterize.
Chain <xarray.DataArray 'chain' ()>
array(3)
Coordinates:
    chain    int32 3 reached the maximum tree depth. Increase `max_treedepth`, increase `target_accept` or reparameterize.
Auto-assigning NUTS sampler...
Initializing NUTS using jitter+adapt_diag...
Sequential sampling (4 chains in 1 job)
NUTS: [x]
Sampling 4 chains for 1_000 tune and 1_000 draw iterations (4_000 + 4_000 draws total) took 42 seconds.
Chain <xarray.DataArray 'chain' ()>
array(0)
Coordinates:
    chain    int32 0 reached the maximum tree depth. Increase `max_treedepth`, increase `target_accept` or reparameterize.
Chain <xarray.DataArray 'chain' ()>
array(1)
Coordinates:
    chain    int32 1 reached the maximum tree depth. Increase `max_treedepth`, increase `target_accept` or reparameterize.
Chain <xarray.DataArray 'chain' ()>
array(2)
Coordinates:
    chain    int32 2 reached the maximum tree depth. Increase `max_treedepth`, increase `target_accept` or reparameterize.
Chain <xarray.DataArray 'chain' ()>
array(3)
Coordinates:
    chain    int32 3 reached the maximum tree depth. Increase `max_treedepth`, increase `target_accept` or reparameterize.
results_df = concat_results(results)
results_df = results_df.reset_index(drop=True)
summaries, summary_means = plot_forest_compare_analytical_dim5(results_df)
summary_means.style.set_caption(
    "MCMC and Analytical Results for 5th Dimension of 10 Dimensional Target Distribution"
)
| 平均值 | 标准差 | hdi_3% | hdi_97% | ess_bulk | ess_tail | r_hat | |
|---|---|---|---|---|---|---|---|
| 采样器 | |||||||
| DEMetropolis | -0.021700 | 2.214500 | -4.125400 | 4.174200 | 2772.400000 | 5331.700000 | 1.010000 |
| DEMetropolisZ | -0.000200 | 2.226000 | -4.188600 | 4.159800 | 3089.100000 | 5587.200000 | 1.000000 |
| NUTS | 0.001400 | 2.257800 | -4.252700 | 4.196400 | 2618.100000 | 2798.000000 | 1.000000 |
| 解析 | 0.000000 | 2.236068 | -4.205582 | 4.205582 | nan | nan | nan |
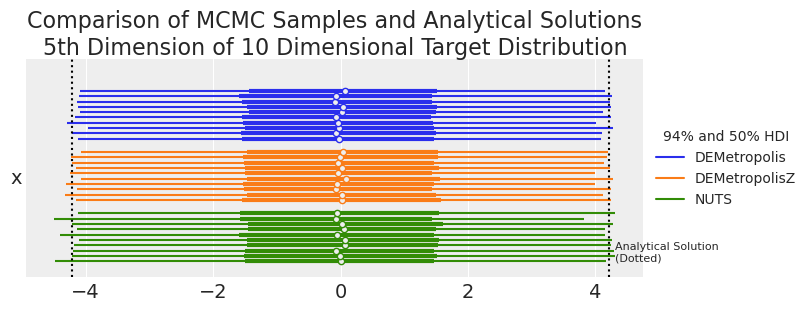
从视觉上看,DEMetropolis 算法看起来是合理准确的,并且与 NUTS 一样准确。由于我们有 10 个要与解析解进行比较的重复,我们可以掸掉我们的传统统计学,并执行一个老式的单侧 t 检验,以查看采样器计算的置信限是否与解析计算的置信限显着不同。
samplers = ["DEMetropolis", "DEMetropolisZ", "NUTS"]
cls_str = ["hdi_3%", "hdi_97%"]
cls_val = [0.03, 0.97]
dist = st.norm(0, np.sqrt(5))
results = []
for sampler in samplers:
    for cl_str, cl_val in zip(cls_str, cls_val):
        mask = summaries.Sampler == sampler
        # collect the credible limits for each MCMC run
        mcmc_cls = summaries.loc[mask, cl_str]

        # calculate the confidence limit for the target dist
        analytical_cl = dist.ppf(cl_val)

        # one sided t-test!
        p_value = st.ttest_1samp(mcmc_cls, analytical_cl).pvalue
        results.append(
            pd.DataFrame(dict(Sampler=[sampler], ConfidenceLimit=[cl_str], Pvalue=[p_value]))
        )
pd.concat(results).style.set_caption(
    "MCMC Replicates Compared to Analytical Solution for Selected Confidence Limits"
)
| 采样器 | 置信限 | P 值 | |
|---|---|---|---|
| 0 | DEMetropolis | hdi_3% | 0.018270 |
| 0 | DEMetropolis | hdi_97% | 0.307391 |
| 0 | DEMetropolisZ | hdi_3% | 0.555155 |
| 0 | DEMetropolisZ | hdi_97% | 0.177881 |
| 0 | NUTS | hdi_3% | 0.336053 |
| 0 | NUTS | hdi_97% | 0.847152 |
较高的 p 值表示 MCMC 算法以高置信度捕获解析值。较低的 p 值意味着与解析计算的置信限相比,MCMC 算法出乎意料地偏高或偏低。NUTS 采样器以高置信度捕获解析计算的值。DEMetropolis 算法的置信度较低,但给出了合理的结果。
50 维度#
对于 Metropolis 算法,更高的维度变得越来越困难。在这里,我们将以非常大的样本量进行采样(这将需要一段时间)以获得至少 2000 个有效样本。
D = 50
reps = 10
samplers = [pm.DEMetropolis] * reps + [pm.DEMetropolisZ] * reps + [pm.NUTS] * reps
coreses = [1] * reps * 3
chainses = [2 * D] * reps + [4] * reps * 2
tunes = drawses = [5000] * reps + [100000] * reps + [1000] * reps

results = []
run = 0
for sampler, tune, draws, cores, chains in zip(samplers, tunes, drawses, coreses, chainses):
    if sampler.name == "nuts":
        results.append(
            sample_model_calc_metrics(
                sampler,
                D,
                tune,
                draws,
                cores=cores,
                chains=chains,
                run=run,
                step_kwargs={},
                sample_kwargs=dict(target_accept=0.95),
            )
        )
    else:
        results.append(
            sample_model_calc_metrics(sampler, D, tune, draws, cores=cores, chains=chains, run=run)
        )
    run += 1

results_df = concat_results(results)
results_df = results_df.reset_index(drop=True)
显示代码单元格输出
Population sampling (100 chains)
DEMetropolis: [x]
Chains are not parallelized. You can enable this by passing `pm.sample(cores=n)`, where n > 1.
Sampling 100 chains for 5_000 tune and 5_000 draw iterations (500_000 + 500_000 draws total) took 459 seconds.
The rhat statistic is larger than 1.01 for some parameters. This indicates problems during sampling. See https://arxiv.org/abs/1903.08008 for details
The effective sample size per chain is smaller than 100 for some parameters.  A higher number is needed for reliable rhat and ess computation. See https://arxiv.org/abs/1903.08008 for details
Population sampling (100 chains)
DEMetropolis: [x]
Chains are not parallelized. You can enable this by passing `pm.sample(cores=n)`, where n > 1.
Sampling 100 chains for 5_000 tune and 5_000 draw iterations (500_000 + 500_000 draws total) took 471 seconds.
The rhat statistic is larger than 1.01 for some parameters. This indicates problems during sampling. See https://arxiv.org/abs/1903.08008 for details
The effective sample size per chain is smaller than 100 for some parameters.  A higher number is needed for reliable rhat and ess computation. See https://arxiv.org/abs/1903.08008 for details
Population sampling (100 chains)
DEMetropolis: [x]
Chains are not parallelized. You can enable this by passing `pm.sample(cores=n)`, where n > 1.
Sampling 100 chains for 5_000 tune and 5_000 draw iterations (500_000 + 500_000 draws total) took 473 seconds.
The rhat statistic is larger than 1.01 for some parameters. This indicates problems during sampling. See https://arxiv.org/abs/1903.08008 for details
The effective sample size per chain is smaller than 100 for some parameters.  A higher number is needed for reliable rhat and ess computation. See https://arxiv.org/abs/1903.08008 for details
Population sampling (100 chains)
DEMetropolis: [x]
Chains are not parallelized. You can enable this by passing `pm.sample(cores=n)`, where n > 1.
Sampling 100 chains for 5_000 tune and 5_000 draw iterations (500_000 + 500_000 draws total) took 467 seconds.
The rhat statistic is larger than 1.01 for some parameters. This indicates problems during sampling. See https://arxiv.org/abs/1903.08008 for details
The effective sample size per chain is smaller than 100 for some parameters.  A higher number is needed for reliable rhat and ess computation. See https://arxiv.org/abs/1903.08008 for details
Population sampling (100 chains)
DEMetropolis: [x]
Chains are not parallelized. You can enable this by passing `pm.sample(cores=n)`, where n > 1.
Sampling 100 chains for 5_000 tune and 5_000 draw iterations (500_000 + 500_000 draws total) took 480 seconds.
The rhat statistic is larger than 1.01 for some parameters. This indicates problems during sampling. See https://arxiv.org/abs/1903.08008 for details
The effective sample size per chain is smaller than 100 for some parameters.  A higher number is needed for reliable rhat and ess computation. See https://arxiv.org/abs/1903.08008 for details
Population sampling (100 chains)
DEMetropolis: [x]
Chains are not parallelized. You can enable this by passing `pm.sample(cores=n)`, where n > 1.
Sampling 100 chains for 5_000 tune and 5_000 draw iterations (500_000 + 500_000 draws total) took 466 seconds.
The rhat statistic is larger than 1.01 for some parameters. This indicates problems during sampling. See https://arxiv.org/abs/1903.08008 for details
The effective sample size per chain is smaller than 100 for some parameters.  A higher number is needed for reliable rhat and ess computation. See https://arxiv.org/abs/1903.08008 for details
Population sampling (100 chains)
DEMetropolis: [x]
Chains are not parallelized. You can enable this by passing `pm.sample(cores=n)`, where n > 1.
Sampling 100 chains for 5_000 tune and 5_000 draw iterations (500_000 + 500_000 draws total) took 580 seconds.
The rhat statistic is larger than 1.01 for some parameters. This indicates problems during sampling. See https://arxiv.org/abs/1903.08008 for details
The effective sample size per chain is smaller than 100 for some parameters.  A higher number is needed for reliable rhat and ess computation. See https://arxiv.org/abs/1903.08008 for details
Population sampling (100 chains)
DEMetropolis: [x]
Chains are not parallelized. You can enable this by passing `pm.sample(cores=n)`, where n > 1.
Sampling 100 chains for 5_000 tune and 5_000 draw iterations (500_000 + 500_000 draws total) took 864 seconds.
The rhat statistic is larger than 1.01 for some parameters. This indicates problems during sampling. See https://arxiv.org/abs/1903.08008 for details
The effective sample size per chain is smaller than 100 for some parameters.  A higher number is needed for reliable rhat and ess computation. See https://arxiv.org/abs/1903.08008 for details
Population sampling (100 chains)
DEMetropolis: [x]
Chains are not parallelized. You can enable this by passing `pm.sample(cores=n)`, where n > 1.
Sampling 100 chains for 5_000 tune and 5_000 draw iterations (500_000 + 500_000 draws total) took 878 seconds.
The rhat statistic is larger than 1.01 for some parameters. This indicates problems during sampling. See https://arxiv.org/abs/1903.08008 for details
The effective sample size per chain is smaller than 100 for some parameters.  A higher number is needed for reliable rhat and ess computation. See https://arxiv.org/abs/1903.08008 for details
Population sampling (100 chains)
DEMetropolis: [x]
Chains are not parallelized. You can enable this by passing `pm.sample(cores=n)`, where n > 1.
Sampling 100 chains for 5_000 tune and 5_000 draw iterations (500_000 + 500_000 draws total) took 855 seconds.
The rhat statistic is larger than 1.01 for some parameters. This indicates problems during sampling. See https://arxiv.org/abs/1903.08008 for details
The effective sample size per chain is smaller than 100 for some parameters.  A higher number is needed for reliable rhat and ess computation. See https://arxiv.org/abs/1903.08008 for details
Sequential sampling (4 chains in 1 job)
DEMetropolisZ: [x]
Sampling 4 chains for 100_000 tune and 100_000 draw iterations (400_000 + 400_000 draws total) took 592 seconds.
Sequential sampling (4 chains in 1 job)
DEMetropolisZ: [x]
Sampling 4 chains for 100_000 tune and 100_000 draw iterations (400_000 + 400_000 draws total) took 451 seconds.
Sequential sampling (4 chains in 1 job)
DEMetropolisZ: [x]
Sampling 4 chains for 100_000 tune and 100_000 draw iterations (400_000 + 400_000 draws total) took 429 seconds.
Sequential sampling (4 chains in 1 job)
DEMetropolisZ: [x]
Sampling 4 chains for 100_000 tune and 100_000 draw iterations (400_000 + 400_000 draws total) took 420 seconds.
Sequential sampling (4 chains in 1 job)
DEMetropolisZ: [x]
Sampling 4 chains for 100_000 tune and 100_000 draw iterations (400_000 + 400_000 draws total) took 422 seconds.
Sequential sampling (4 chains in 1 job)
DEMetropolisZ: [x]
Sampling 4 chains for 100_000 tune and 100_000 draw iterations (400_000 + 400_000 draws total) took 425 seconds.
Sequential sampling (4 chains in 1 job)
DEMetropolisZ: [x]
Sampling 4 chains for 100_000 tune and 100_000 draw iterations (400_000 + 400_000 draws total) took 364 seconds.
Sequential sampling (4 chains in 1 job)
DEMetropolisZ: [x]
Sampling 4 chains for 100_000 tune and 100_000 draw iterations (400_000 + 400_000 draws total) took 208 seconds.
Sequential sampling (4 chains in 1 job)
DEMetropolisZ: [x]
Sampling 4 chains for 100_000 tune and 100_000 draw iterations (400_000 + 400_000 draws total) took 206 seconds.
Sequential sampling (4 chains in 1 job)
DEMetropolisZ: [x]
Sampling 4 chains for 100_000 tune and 100_000 draw iterations (400_000 + 400_000 draws total) took 212 seconds.
Auto-assigning NUTS sampler...
Initializing NUTS using jitter+adapt_diag...
Sequential sampling (4 chains in 1 job)
NUTS: [x]
Sampling 4 chains for 1_000 tune and 1_000 draw iterations (4_000 + 4_000 draws total) took 32 seconds.
Chain <xarray.DataArray 'chain' ()>
array(0)
Coordinates:
    chain    int32 0 reached the maximum tree depth. Increase `max_treedepth`, increase `target_accept` or reparameterize.
Chain <xarray.DataArray 'chain' ()>
array(1)
Coordinates:
    chain    int32 1 reached the maximum tree depth. Increase `max_treedepth`, increase `target_accept` or reparameterize.
Chain <xarray.DataArray 'chain' ()>
array(2)
Coordinates:
    chain    int32 2 reached the maximum tree depth. Increase `max_treedepth`, increase `target_accept` or reparameterize.
Chain <xarray.DataArray 'chain' ()>
array(3)
Coordinates:
    chain    int32 3 reached the maximum tree depth. Increase `max_treedepth`, increase `target_accept` or reparameterize.
Auto-assigning NUTS sampler...
Initializing NUTS using jitter+adapt_diag...
Sequential sampling (4 chains in 1 job)
NUTS: [x]
Sampling 4 chains for 1_000 tune and 1_000 draw iterations (4_000 + 4_000 draws total) took 31 seconds.
Chain <xarray.DataArray 'chain' ()>
array(0)
Coordinates:
    chain    int32 0 reached the maximum tree depth. Increase `max_treedepth`, increase `target_accept` or reparameterize.
Chain <xarray.DataArray 'chain' ()>
array(1)
Coordinates:
    chain    int32 1 reached the maximum tree depth. Increase `max_treedepth`, increase `target_accept` or reparameterize.
Chain <xarray.DataArray 'chain' ()>
array(2)
Coordinates:
    chain    int32 2 reached the maximum tree depth. Increase `max_treedepth`, increase `target_accept` or reparameterize.
Chain <xarray.DataArray 'chain' ()>
array(3)
Coordinates:
    chain    int32 3 reached the maximum tree depth. Increase `max_treedepth`, increase `target_accept` or reparameterize.
Auto-assigning NUTS sampler...
Initializing NUTS using jitter+adapt_diag...
Sequential sampling (4 chains in 1 job)
NUTS: [x]
Sampling 4 chains for 1_000 tune and 1_000 draw iterations (4_000 + 4_000 draws total) took 29 seconds.
Chain <xarray.DataArray 'chain' ()>
array(0)
Coordinates:
    chain    int32 0 reached the maximum tree depth. Increase `max_treedepth`, increase `target_accept` or reparameterize.
Chain <xarray.DataArray 'chain' ()>
array(1)
Coordinates:
    chain    int32 1 reached the maximum tree depth. Increase `max_treedepth`, increase `target_accept` or reparameterize.
Chain <xarray.DataArray 'chain' ()>
array(2)
Coordinates:
    chain    int32 2 reached the maximum tree depth. Increase `max_treedepth`, increase `target_accept` or reparameterize.
Chain <xarray.DataArray 'chain' ()>
array(3)
Coordinates:
    chain    int32 3 reached the maximum tree depth. Increase `max_treedepth`, increase `target_accept` or reparameterize.
Auto-assigning NUTS sampler...
Initializing NUTS using jitter+adapt_diag...
Sequential sampling (4 chains in 1 job)
NUTS: [x]
Sampling 4 chains for 1_000 tune and 1_000 draw iterations (4_000 + 4_000 draws total) took 32 seconds.
Chain <xarray.DataArray 'chain' ()>
array(0)
Coordinates:
    chain    int32 0 reached the maximum tree depth. Increase `max_treedepth`, increase `target_accept` or reparameterize.
Chain <xarray.DataArray 'chain' ()>
array(1)
Coordinates:
    chain    int32 1 reached the maximum tree depth. Increase `max_treedepth`, increase `target_accept` or reparameterize.
Chain <xarray.DataArray 'chain' ()>
array(2)
Coordinates:
    chain    int32 2 reached the maximum tree depth. Increase `max_treedepth`, increase `target_accept` or reparameterize.
Chain <xarray.DataArray 'chain' ()>
array(3)
Coordinates:
    chain    int32 3 reached the maximum tree depth. Increase `max_treedepth`, increase `target_accept` or reparameterize.
Auto-assigning NUTS sampler...
Initializing NUTS using jitter+adapt_diag...
Sequential sampling (4 chains in 1 job)
NUTS: [x]
Sampling 4 chains for 1_000 tune and 1_000 draw iterations (4_000 + 4_000 draws total) took 29 seconds.
Chain <xarray.DataArray 'chain' ()>
array(0)
Coordinates:
    chain    int32 0 reached the maximum tree depth. Increase `max_treedepth`, increase `target_accept` or reparameterize.
Chain <xarray.DataArray 'chain' ()>
array(1)
Coordinates:
    chain    int32 1 reached the maximum tree depth. Increase `max_treedepth`, increase `target_accept` or reparameterize.
Chain <xarray.DataArray 'chain' ()>
array(2)
Coordinates:
    chain    int32 2 reached the maximum tree depth. Increase `max_treedepth`, increase `target_accept` or reparameterize.
Chain <xarray.DataArray 'chain' ()>
array(3)
Coordinates:
    chain    int32 3 reached the maximum tree depth. Increase `max_treedepth`, increase `target_accept` or reparameterize.
Auto-assigning NUTS sampler...
Initializing NUTS using jitter+adapt_diag...
Sequential sampling (4 chains in 1 job)
NUTS: [x]
Sampling 4 chains for 1_000 tune and 1_000 draw iterations (4_000 + 4_000 draws total) took 31 seconds.
Chain <xarray.DataArray 'chain' ()>
array(0)
Coordinates:
    chain    int32 0 reached the maximum tree depth. Increase `max_treedepth`, increase `target_accept` or reparameterize.
Chain <xarray.DataArray 'chain' ()>
array(1)
Coordinates:
    chain    int32 1 reached the maximum tree depth. Increase `max_treedepth`, increase `target_accept` or reparameterize.
Chain <xarray.DataArray 'chain' ()>
array(2)
Coordinates:
    chain    int32 2 reached the maximum tree depth. Increase `max_treedepth`, increase `target_accept` or reparameterize.
Chain <xarray.DataArray 'chain' ()>
array(3)
Coordinates:
    chain    int32 3 reached the maximum tree depth. Increase `max_treedepth`, increase `target_accept` or reparameterize.
Auto-assigning NUTS sampler...
Initializing NUTS using jitter+adapt_diag...
Sequential sampling (4 chains in 1 job)
NUTS: [x]
Sampling 4 chains for 1_000 tune and 1_000 draw iterations (4_000 + 4_000 draws total) took 29 seconds.
Chain <xarray.DataArray 'chain' ()>
array(0)
Coordinates:
    chain    int32 0 reached the maximum tree depth. Increase `max_treedepth`, increase `target_accept` or reparameterize.
Chain <xarray.DataArray 'chain' ()>
array(1)
Coordinates:
    chain    int32 1 reached the maximum tree depth. Increase `max_treedepth`, increase `target_accept` or reparameterize.
Chain <xarray.DataArray 'chain' ()>
array(2)
Coordinates:
    chain    int32 2 reached the maximum tree depth. Increase `max_treedepth`, increase `target_accept` or reparameterize.
Chain <xarray.DataArray 'chain' ()>
array(3)
Coordinates:
    chain    int32 3 reached the maximum tree depth. Increase `max_treedepth`, increase `target_accept` or reparameterize.
Auto-assigning NUTS sampler...
Initializing NUTS using jitter+adapt_diag...
Sequential sampling (4 chains in 1 job)
NUTS: [x]
Sampling 4 chains for 1_000 tune and 1_000 draw iterations (4_000 + 4_000 draws total) took 30 seconds.
Chain <xarray.DataArray 'chain' ()>
array(0)
Coordinates:
    chain    int32 0 reached the maximum tree depth. Increase `max_treedepth`, increase `target_accept` or reparameterize.
Chain <xarray.DataArray 'chain' ()>
array(1)
Coordinates:
    chain    int32 1 reached the maximum tree depth. Increase `max_treedepth`, increase `target_accept` or reparameterize.
Chain <xarray.DataArray 'chain' ()>
array(2)
Coordinates:
    chain    int32 2 reached the maximum tree depth. Increase `max_treedepth`, increase `target_accept` or reparameterize.
Chain <xarray.DataArray 'chain' ()>
array(3)
Coordinates:
    chain    int32 3 reached the maximum tree depth. Increase `max_treedepth`, increase `target_accept` or reparameterize.
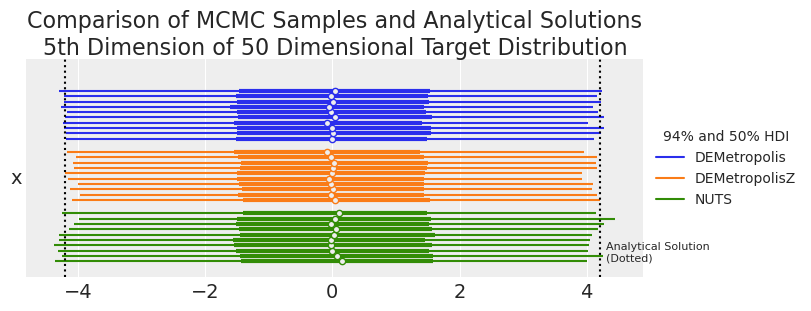
summaries, summary_means = plot_forest_compare_analytical_dim5(results_df)
summary_means.style.set_caption(
    "MCMC and Analytical Results for 5th Dimension of 50 Dimensional Target Distribution"
)
| 平均值 | 标准差 | hdi_3% | hdi_97% | ess_bulk | ess_tail | r_hat | |
|---|---|---|---|---|---|---|---|
| 采样器 | |||||||
| DEMetropolis | -0.007700 | 2.236900 | -4.224400 | 4.178500 | 2583.200000 | 5619.600000 | 1.034000 |
| DEMetropolisZ | -0.009700 | 2.172500 | -4.088500 | 4.079600 | 2616.800000 | 5408.700000 | 1.000000 |
| NUTS | 0.030000 | 2.244200 | -4.235000 | 4.144900 | 2552.600000 | 2811.200000 | 1.000000 |
| 解析 | 0.000000 | 2.236068 | -4.205582 | 4.205582 | nan | nan | nan |
samplers = ["DEMetropolis", "DEMetropolisZ", "NUTS"]
cls_str = ["hdi_3%", "hdi_97%"]
cls_val = [0.03, 0.97]
results = []
for sampler in samplers:
    for cl_str, cl_val in zip(cls_str, cls_val):
        mask = summaries.Sampler == sampler

        # collect the credible limits for each MCMC run
        mcmc_cls = summaries.loc[mask, cl_str]

        # calculate the confidence limit for the target dist
        analytical_cl = dist.ppf(cl_val)

        # one sided t-test!
        p_value = st.ttest_1samp(mcmc_cls, analytical_cl).pvalue

        results.append(
            pd.DataFrame(dict(Sampler=[sampler], ConfidenceLimit=[cl_str], Pvalue=[p_value]))
        )
pd.concat(results).style.set_caption(
    "MCMC Replicates Compared to Analytical Solution for Selected Confidence Limits"
)
| 采样器 | 置信限 | P 值 | |
|---|---|---|---|
| 0 | DEMetropolis | hdi_3% | 0.152028 |
| 0 | DEMetropolis | hdi_97% | 0.318463 |
| 0 | DEMetropolisZ | hdi_3% | 0.001217 |
| 0 | DEMetropolisZ | hdi_97% | 0.005154 |
| 0 | NUTS | hdi_3% | 0.490542 |
| 0 | NUTS | hdi_97% | 0.212516 |
我们可以看到,在 50 维度下,与 DEMetropolis 相比,DEMetropolisZ 采样器的覆盖率较差。因此,即使 DEMetropolisZ 比 DEMetropolis 更有效率并且具有更低的 \(\hat{R}\) 值,也建议将 DEMetropolis 用于更高维度的问题。
结论#
根据本笔记本中的结果,如果您无法使用 NUTS,对于较低维度的问题(例如,\(10D\)),请使用 DEMetropolisZ,因为它更有效率并且收敛性更好。对于更高维度的问题(例如,\(50D\)),请使用 DEMetropolis,以更好地捕获目标分布的尾部。
%load_ext watermark
%watermark -n -u -v -iv -w
Last updated: Fri Feb 10 2023

Python implementation: CPython
Python version       : 3.11.0
IPython version      : 8.7.0

pymc      : 5.0.1+5.ga7f361bd
numpy     : 1.24.0
pandas    : 1.5.2
sys       : 3.11.0 | packaged by conda-forge | (main, Oct 25 2022, 06:12:32) [MSC v.1929 64 bit (AMD64)]
matplotlib: 3.6.2
scipy     : 1.9.3
arviz     : 0.14.0

Watermark: 2.3.1